-
Introduction
If you want to speak the language of price action, candlestick charts are your Rosetta Stone. These little colored bars aren’t just pretty—they tell stories about market psychology, supply and demand, and momentum. Whether you’re trading Forex, crypto, or stocks, candlesticks are one of the most essential tools for chart analysis. And reading them like a pro isn’t just about memorizing patterns—it’s about understanding what the market is feeling. This blog will break down everything you need to know about reading candlestick charts, from structure and key patterns to psychological interpretation and real-world application.
-
What Are Candlestick Charts?
Candlestick charts are a type of price chart that display the high, low, open, and close of a financial instrument over a specific period. Each candlestick gives traders critical information about price action within a single time frame.
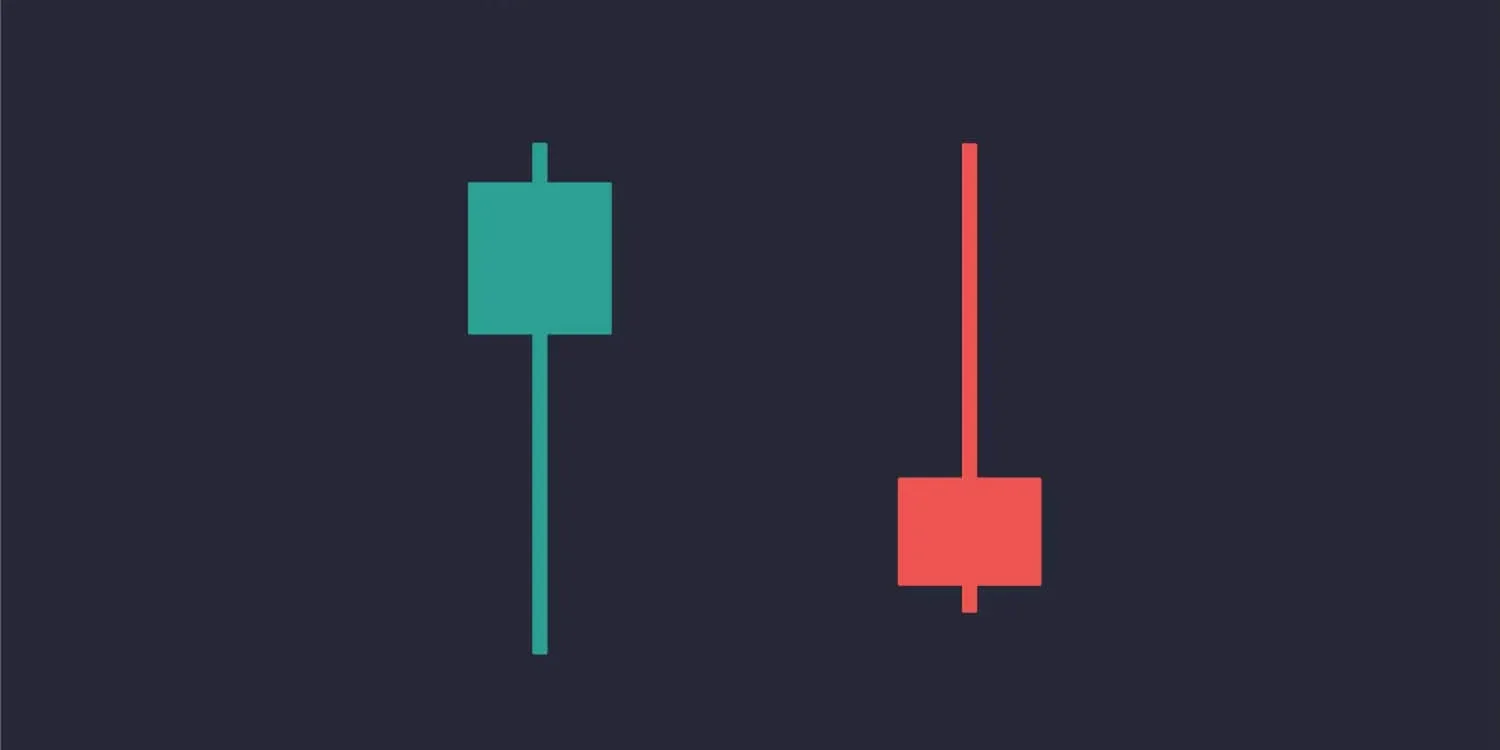
🔸 A bullish candle usually forms when the closing price is higher than the opening price (often green or white).
🔸 A bearish candle forms when the closing price is lower than the opening price (often red or black).
🔸 The body represents the open-to-close range.
🔸 The wick/shadow shows the intraday high and low.
One candle = one story. A chart full of them = a novel of market emotions. These charts originated in Japan during the 18th century when a rice trader named Munehisa Homma discovered patterns in price movements that reflected the psychology of buyers and sellers. Since then, candlestick charts have evolved and are now one of the most widely used tools in modern technical analysis.
-
Anatomy of a Candlestick
Before decoding patterns, you need to understand the parts of a candle:
🔸 Open: The price at the beginning of the time period. This tells you where the battle between bulls and bears started.
🔸 Close: The price at the end of the time period. It shows who won the battle—bulls or bears.
🔸 High: The highest price reached during that period, reflecting the upper limit of bullish pressure.
🔸 Low: The lowest price reached, showing how far bears pushed the price.
🔸 Body: The thick part of the candle (open to close). A long body suggests strong momentum in one direction.
🔸 Wick/Shadow: The lines above and below the body (high and low). Long wicks can indicate rejection or uncertainty.
Understanding each part of a candle helps you visualize market activity in a simple, compact format. Every candle has a tale to tell—from strong breakouts to failed attempts, consolidations, or battles between buyers and sellers.
-
Timeframes and Context Matter
Candlestick patterns are only meaningful when you view them in context. One mistake beginners often make is overreacting to individual candles without considering the bigger picture.
🔸 A bullish candle on the 5-minute chart might look exciting—but on the 1-hour chart, it could be just noise.
🔸 Context includes trend direction, support/resistance levels, and volume.
🔸 Use multiple timeframes for confirmation. For example, a bullish engulfing pattern on the 1-hour chart carries more weight if the daily chart is also showing an uptrend.
Pros never trade a candle in isolation. Instead, they analyze the story it tells within the broader trend and key price zones.
-
Basic Candlestick Patterns You Must Know
Here are the foundational candlestick patterns every trader must recognize:
🔸 Doji: Open and close are nearly equal. Signals indecision. The market is unsure, and momentum could shift in either direction. Dojis are often found before reversals, especially at the top or bottom of trends.
🔸 Hammer: Small body, long lower wick. Found at bottom of downtrend. Indicates that bears tried to push the price lower, but bulls stepped in with strength. This shows potential reversal.
🔸 Shooting Star: Small body, long upper wick. Found at top of uptrend. It shows buyers tried to push higher but failed, and sellers gained control.
🔸 Bullish Engulfing: A small red candle followed by a big green one that ‘engulfs’ it. This pattern suggests a powerful bullish reversal.
🔸 Bearish Engulfing: A small green candle followed by a large red one that completely overshadows the previous candle. It’s a strong bearish signal.
These basic patterns give insight into short-term changes in market sentiment. They work best when aligned with trendlines, moving averages, or support/resistance zones.
-
Advanced Patterns for Pro-Level Trading
Once you master the basics, level up with these pro patterns that offer more reliable signals when combined with volume and trend analysis:
🔸 Morning Star: A three-candle bullish reversal pattern. The first candle is bearish, the second is a small-bodied candle showing indecision, and the third is a strong bullish candle. This combo suggests a shift from selling pressure to buying momentum.
🔸 Evening Star: The bearish version of the Morning Star. Appears after an uptrend and can signal a strong reversal.
🔸 Three White Soldiers: Three consecutive strong bullish candles. Indicates sustained buying interest and a likely continuation of the uptrend.
🔸 Three Black Crows: Three bearish candles in a row, each closing lower. It suggests increasing bearish momentum.
🔸 Harami Patterns: These appear as a small-bodied candle within the body of the previous larger candle. Can be bullish or bearish, depending on trend context, and signal a potential pause or reversal.
These patterns are most effective when confirmed by other indicators such as RSI (Relative Strength Index), MACD (Moving Average Convergence Divergence), or significant price zones.
-
Psychological Meaning Behind Candles
Candlestick charts don’t just show price movement—they reveal the emotional tug-of-war happening behind the scenes:
🔸 Long wicks = Rejection or indecision. For example, a long upper wick shows that bulls tried to push higher but failed.
🔸 Small bodies = Indecision or consolidation. The market is pausing or unsure about the next move.
🔸 Big bodies = Strong momentum and conviction. A wide candle body shows one side clearly dominated that session.
🔸 Gaps = Strong emotional reactions. In stocks, gaps often result from earnings, news, or economic data. In crypto or Forex, gaps may occur during low-liquidity hours.
When you interpret candles psychologically, you gain a deeper edge over traders who only react to visuals.
-
Common Mistakes to Avoid
🔸 Ignoring the trend: Trying to trade a reversal pattern against a strong trend usually ends in losses. Trade with the trend unless there’s strong confirmation of reversal.
🔸 Pattern hunting: Forcing a pattern where none exists leads to overtrading. Not every candle is a trade signal.
🔸 Skipping volume analysis: Volume confirms whether a breakout or pattern has conviction. A candle without volume is like a promise with no backing.
🔸 Disregarding market structure: Always consider higher highs/lows, support/resistance, and overall context before trusting any pattern.
Patience, discipline, and context are key to reading candlestick charts effectively.
-
Building a Candlestick-Based Trading Strategy
Want to trade using candles? Here’s how to put it together:
🔸 Define Your Trading Style: Are you a scalper, day trader, or swing trader? Your timeframe determines how you interpret candlestick patterns.
🔸 Combine with Indicators: Candles work best with moving averages (e.g., 20 EMA), RSI, and Fibonacci levels. Use indicators to confirm what candles suggest.
🔸 Use Multiple Timeframe Analysis: A bullish engulfing on the 1-hour chart holds more weight if the daily trend is also bullish. Always check the bigger picture.
🔸 Set Clear Entry & Exit Rules: Define what kind of candles or patterns trigger your entries. Use stop-loss orders just below/above wicks to manage risk.
🔸 Backtest and Practice: Use historical charts to test your strategy. Practice on demo accounts to gain confidence before risking real money.
-
Conclusion: From Candle Novice to Chart Ninja
Reading candlestick charts like a pro doesn’t mean memorizing a million patterns—it means understanding what price is telling you and why it’s doing it. It’s about combining patterns with context, confluence, and discipline. Whether you’re scalping on the 5-minute or swing trading daily charts, candlesticks are your direct connection to market psychology.
When you understand how buyers and sellers battle it out, how emotions shift throughout a trading session, and how the market speaks through candles, you begin to trade with confidence—not confusion. So slow down. Observe. Study the candles. Because once you learn their language, you’ll never trade blind again.